The answers you're calculating
on the way to the floor.
MobiOffice surfaces your color consumption, dispatch costs, stage-wise bottlenecks, and program profitability — without you having to dig through registers or compile reports manually.
We reply within 2 hours
Questions MobiOffice answers — instantly
Every question an owner asks mid-walk through the process house.
How much dye was consumed vs. what was planned for this lot?
What is the dispatch cost per lot and per taka this week?
Which lots are still stuck at a stage — and for how many days?
Which programs have been received but not started for over 7 days?
Which program has the highest overhead cost?
How does my job work production compare to dispatch quantities?
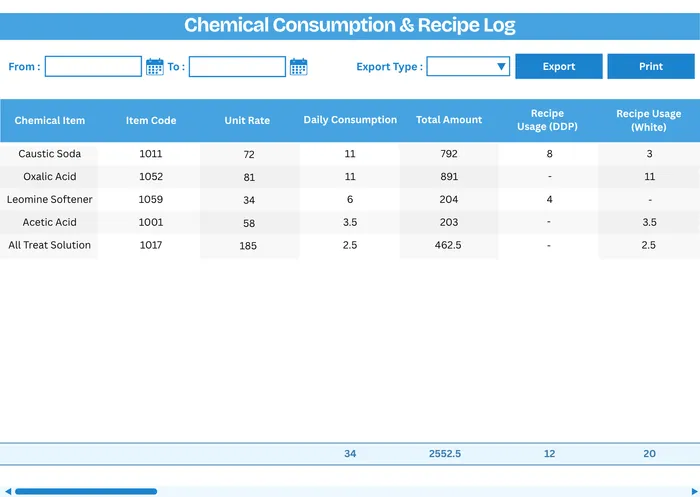
Actual dye usage vs. recipe standard — per shade.
See how much dye was actually consumed against the standard recipe for every batch. Identify shades where overconsumption is eating into your margin before the month closes.
- Actual vs. planned dye consumption tracked across lots and programs
- Chemical-wise consumption data by stage, process group, and machine
- Real-time visibility into color inventory to reduce waste
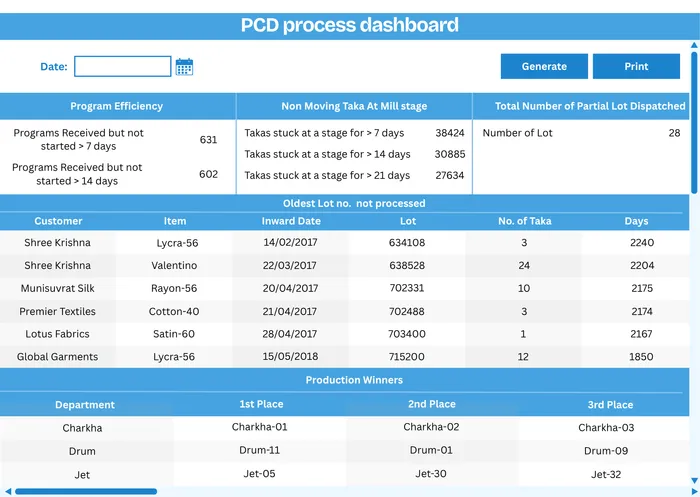
PCD workflow visibility from order receipt to dispatch.
Visualize the Planned Completion Date workflow end-to-end. See which programs were received but not yet started, which takas are stuck at a mill stage, and the top oldest lots that have not been processed — all in one dashboard.
- Program efficiency — programs not started beyond 7 or 14 days
- Non-moving takas at mill stage flagged by days stuck
- Top oldest lots not processed with days outstanding
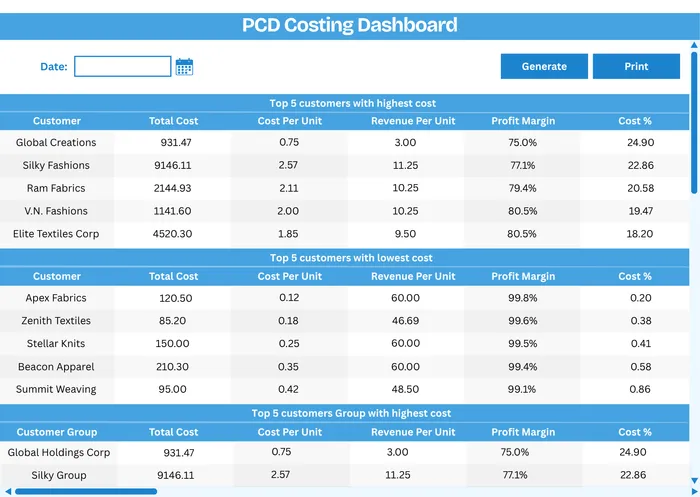
Revenue performance and cost variance against PCD timelines.
The PCD Revenue Dashboard tracks invoiced amounts, top customers by revenue, and revenue-at-risk for delayed lots. The PCD Costing Dashboard consolidates actual vs. planned costs — giving management a clear picture of profitability by order and the financial impact of production delays.
- Revenue by customer and item — current month vs. last month
- Cost percentage by customer and order
- Actual vs. planned cost variance mapped to PCD timelines
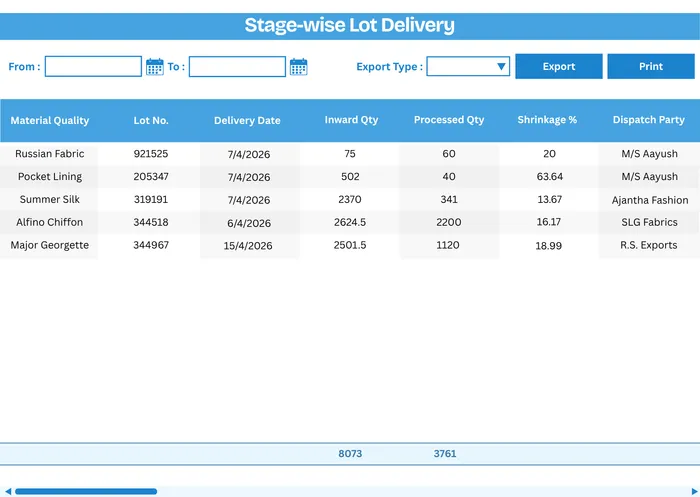
See where every lot is — and how long it has been there.
The Stage-wise Lot Delivery Report shows every lot's current stage, the date it entered, and how many days it has been pending. Spot delayed lots before they breach buyer delivery deadlines.
- Lot progress tracked through every stage from booking to dispatch
- Real-time stage status for operations visibility
- Forecast delivery dates and proactively manage exceptions
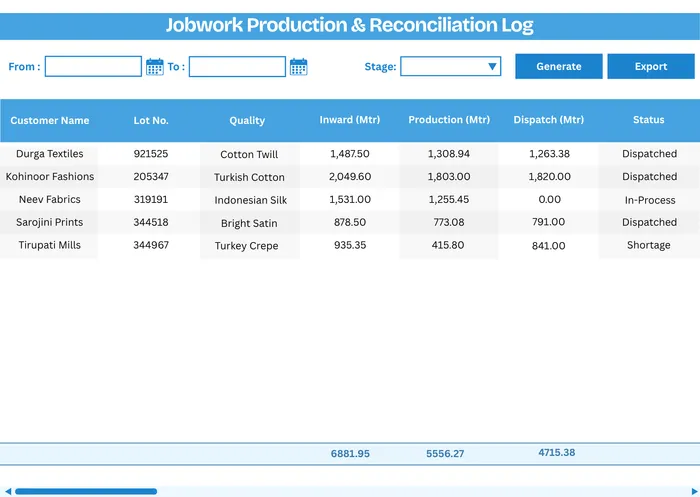
Compare job work output against dispatch. In one view.
The Job Work Production vs. Dispatch report compares what was produced against what was dispatched for every job work order. Identify pending lots, track fulfillment rates, and close the gap between production completion and customer delivery.
- Job work output vs. dispatch quantities in one view
- Pending lots and fulfillment rate per party
- Production-to-dispatch gap tracking for job work orders
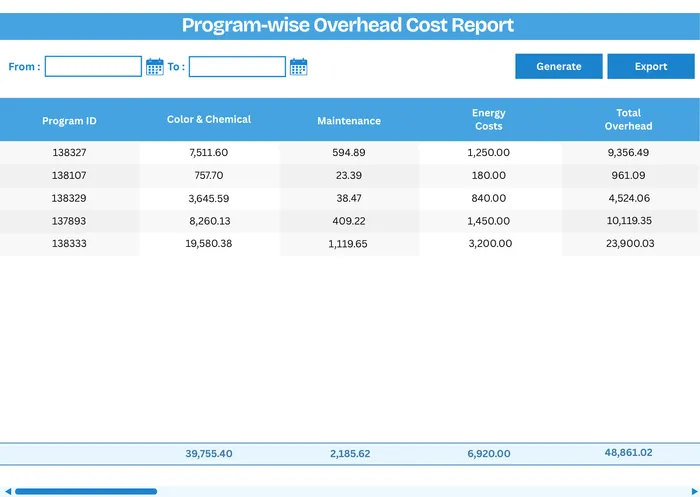
Which programs are the least profitable?
Allocate indirect costs — utilities, labour, machine depreciation — across dyeing programs. Understand true program profitability and make informed decisions on pricing and resource allocation.
- Overhead cost by program — color chemical, wages, energy, maintenance, salary
- Indirect cost allocation for true program profitability
- Informed pricing and resource allocation decisions
Want to see these reports for your unit?
Share your programs and lot data on WhatsApp. We'll show you what the PCD dashboards and reports look like on your actual data.